import matplotlib.pyplot as plt import numpy as np
x = np.linspace(0, 2, 100)
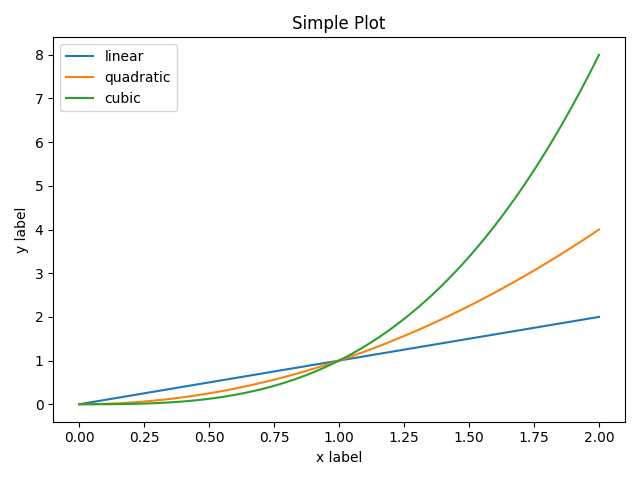
# Note that even in the OO-style, we use `.pyplot.figure` to create the figure. fig, ax = plt.subplots() # Create a figure and an axes. ax.plot(x, x, label='linear') # Plot some data on the axes. ax.plot(x, x**2, label='quadratic') # Plot more data on the axes... ax.plot(x, x**3, label='cubic') # ... and some more. ax.set_xlabel('x label') # Add an x-label to the axes. ax.set_ylabel('y label') # Add a y-label to the axes. ax.set_title("Simple Plot") # Add a title to the axes. ax.legend() # Add a legend.
plt.show()
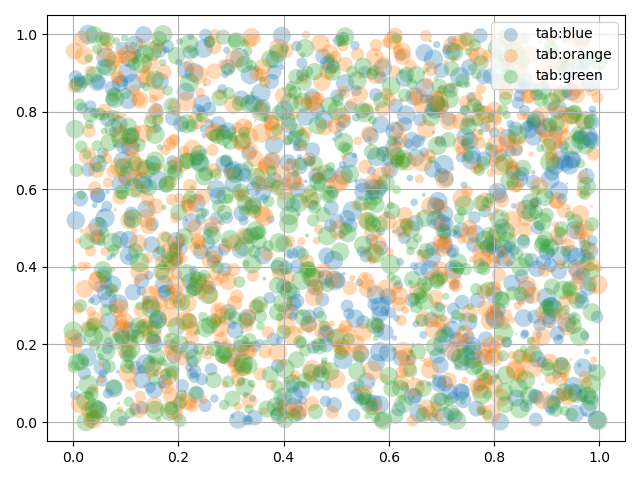
散点图
散点图主要使用函数Scatter,然后输入点的x坐标列表和y坐标列表即可
1
2
3
4
5
6
7
8
9
10
11
12
13
14
15
16
import numpy as np import matplotlib.pyplot as plt
np.random.seed(19680801) fig, ax = plt.subplots() for color in ['tab:blue', 'tab:orange', 'tab:green']: n = 750 x, y = np.random.rand(2, n) scale = 200.0 * np.random.rand(n) ax.scatter(x, y, c=color, s=scale, label=color, alpha=0.3, edgecolors='none')
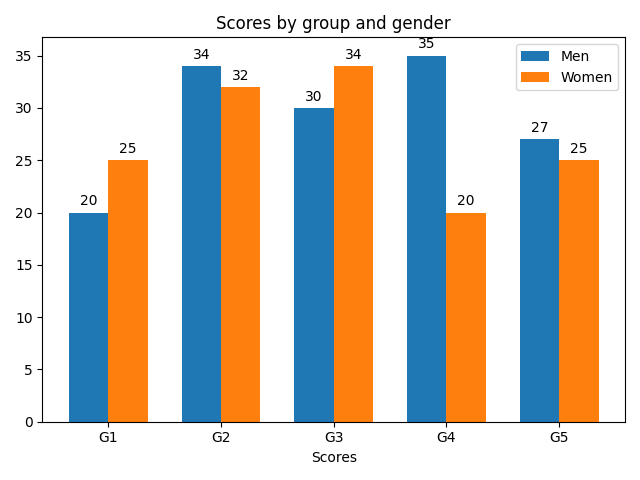
# Add some text for labels, title and custom x-axis tick labels, etc. ax.set_ylabel('Scores') ax.set_title('Scores by group and gender') ax.set_xticks(x) ax.set_xticklabels(labels) ax.legend()
import matplotlib.pyplot as plt import numpy as np
# Fixing random state for reproducibility np.random.seed(19680801)
plt.rcdefaults() fig, ax = plt.subplots()
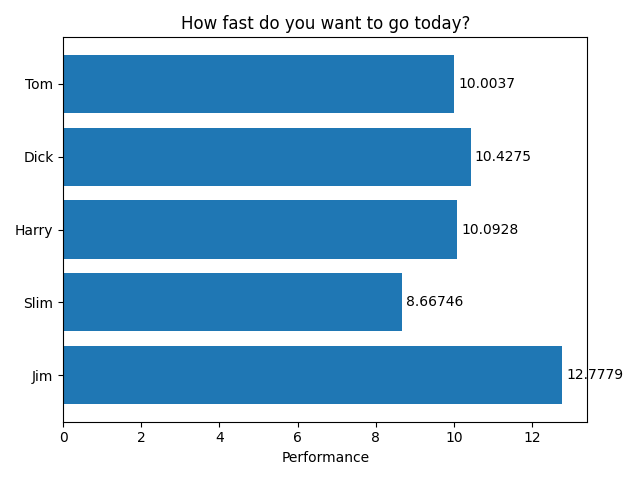
# Example data people = ('Tom', 'Dick', 'Harry', 'Slim', 'Jim') y_pos = np.arange(len(people)) performance = 3 + 10 * np.random.rand(len(people)) error = np.random.rand(len(people))
rects1 = ax.barh(y_pos, performance, align='center') ax.set_yticks(y_pos) ax.set_yticklabels(people) ax.invert_yaxis() # labels read top-to-bottom ax.set_xlabel('Performance') ax.set_title('How fast do you want to go today?') ax.bar_label(rects1, padding=3) plt.show()
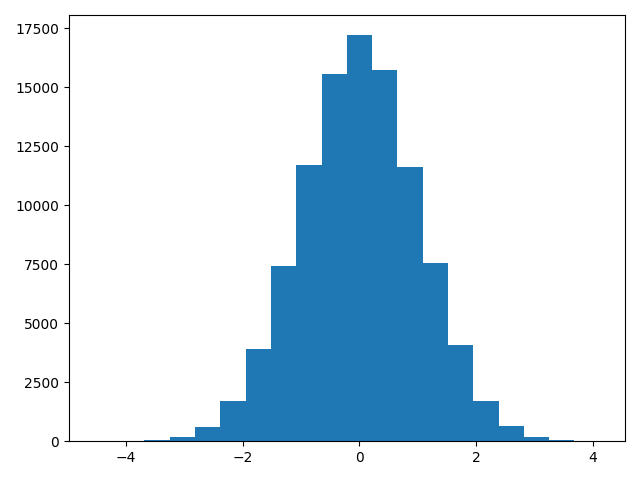
# We can set the number of bins with the `bins` kwarg axs.hist(x, bins=n_bins) plt.show()
hist参数中bins是指条形的个数像这个图里面就是20个条形
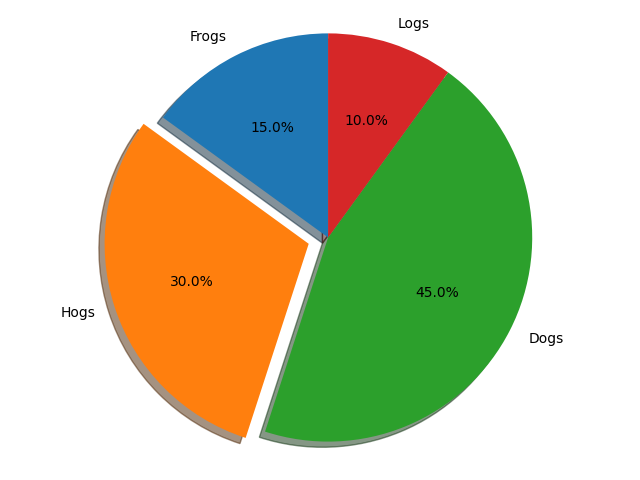
饼状图
饼状图可以看清一个分布,也就是一堆数据当中各种类别的分布。画饼状图主要使用pie函数
1
2
3
4
5
6
7
8
9
10
11
12
13
import matplotlib.pyplot as plt
# Pie chart, where the slices will be ordered and plotted counter-clockwise: labels = 'Frogs', 'Hogs', 'Dogs', 'Logs' sizes = [15, 30, 45, 10] explode = (0, 0.1, 0, 0) # only "explode" the 2nd slice (i.e. 'Hogs')
fig1, ax1 = plt.subplots() ax1.pie(sizes, explode=explode, labels=labels, autopct='%1.1f%%', shadow=True, startangle=90) ax1.axis('equal') # Equal aspect ratio ensures that pie is drawn as a circle.